 Ross Ord
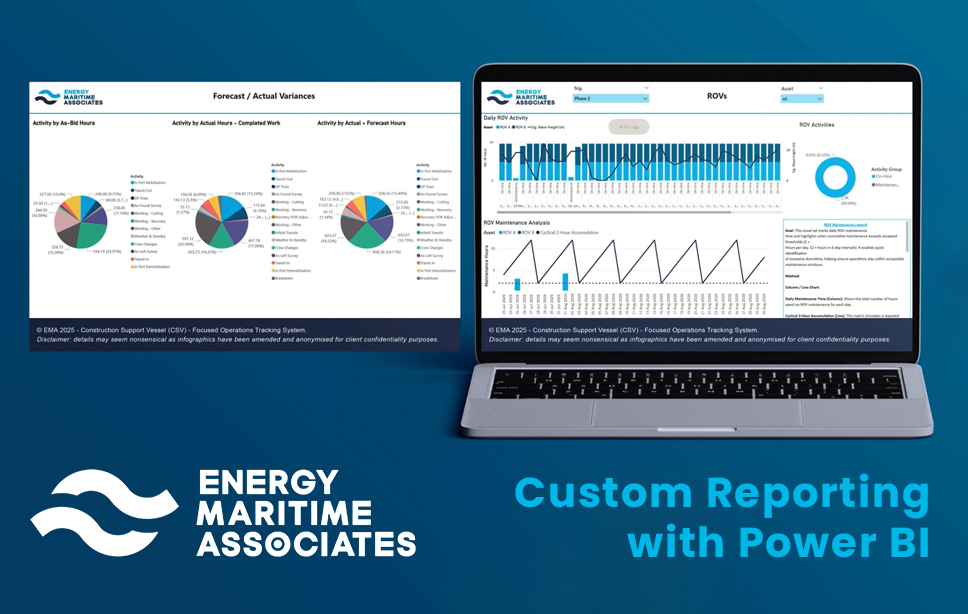
Enhancing Offshore Operational Insights with Custom Power BI Reporting
The offshore energy sector is undergoing a digital transformation. As projects grow in complexity and cost, the need for real-time, data-driven...
An E&P company needed a single, standardized way to track and consolidate all this information so that project teams could report daily progress consistently and feed a clean dataset into Power BI for automated dashboards.
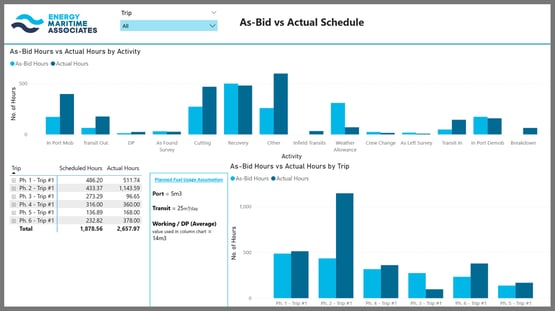
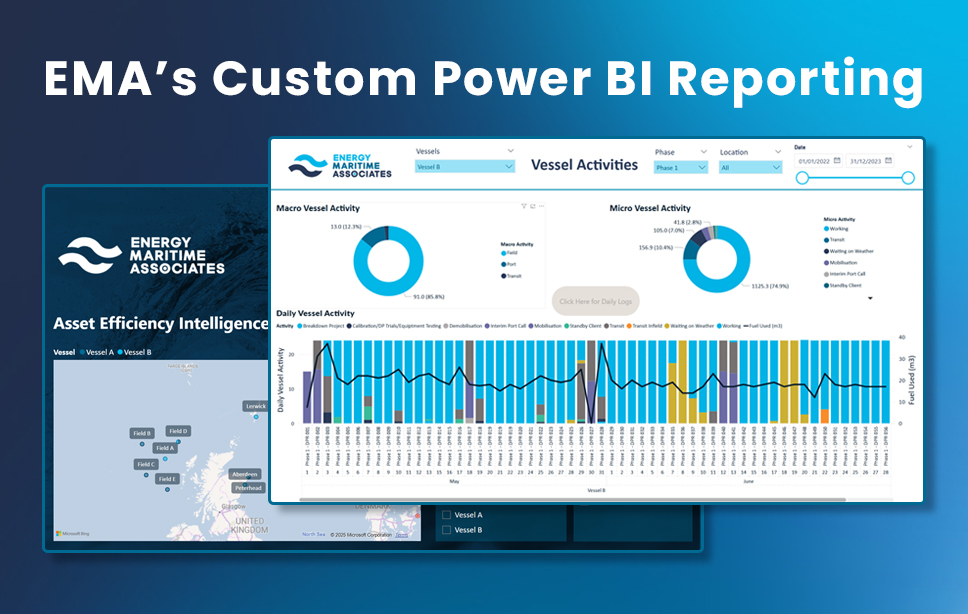
To solve this, Energy Maritime Associates (EMA) designed and built a unified construction support vessel (CSV)-focused operations tracking system that harmonizes inputs from multiple reporting sources and provides an auditable data structure for ongoing operations. Central to this was the ability to track contracted hours against actual performance in real-time, giving project teams immediate visibility into schedule variance and contract compliance.
The first step was to review the E&P company's reporting requirements and the various data sources provided to them by the relevant Marine Contractor. By analysing how this contractor-generated information was structured and what operational details it captured, we identified the key reporting domains to include in the tracking system
The data source included metrics such as:
The goal was to consolidate this data into a clean, consistent, and interactive Power BI model.
To make the data usable, we created a normalized data structure that allows each dataset to be captured independently while remaining connected through consistent campaign and date logic.
|
CSV Daily Operations |
HSE & QHSE Tracking |
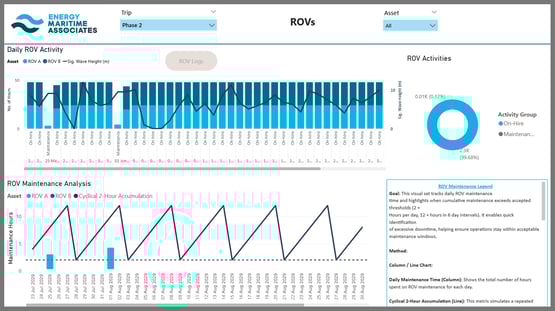
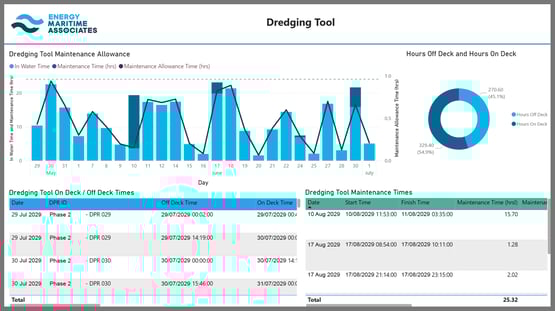
ROV & Dredging Tool Operations |
Project Activity & Progress |
|
|
|
|
|
Personnel Tracking |
Vessel Operations |
Fuel, Consumables & Equipment |
Campaign Structure |
|
|
|
|
This structure ensures every part of the CSV’s operation was captured cleanly, consistently, and in a way that supports analytics.
With the requirements clear, the raw data collected, and the overall structure defined, we developed a Power BI model built around multiple datasets, each representing a distinct operational domain from the CSV. This was achieved by:
This approach maintains the integrity of each operational dataset while enabling unified reporting across the entire campaign.
The result is a flexible, scalable data model that captures CSV operations reporting in an easily interpreted and interactive way. This is achieved via multiple data streams flowing into a connected analytical environment.

The completed tracking system, structured around one integrated CSV-focused reporting framework, consolidates:
As-bid vs. actual offshore durations
Daily operational summaries
Full event logs
ROV & dredging tool operations and allowances
Project progress reporting
Weather conditions and downtime
Fuel consumption analysis
Personnel onboard spread movements
Equipment onboarding and offloading
Segmented individual campaign analysis
By consolidating all vessel-level reporting into a single structured operations tracker, the E&P company now benefits from:
✅ Faster and cleaner DPR reporting
✅ Automated and interactive Power BI dashboards
✅ Better visibility across the campaign
✅ Consistent vessel-level analytics
✅ A scalable structure for future projects
This CSV operations tracker now forms the backbone of the the E&P company’s their offshore vessel reporting process and has significantly improved their ability to monitor and manage CSV operations.

Energy Maritime Associates (EMA) helps offshore leaders move with confidence through market intelligence, independent analysis, and decades of experience. We give your team the tools to cut through data overload and stay ahead of market shifts.
Access reliable offshore intelligence, expert advisory support, and custom reports built around your specific needs. Learn more about our custom Power BI reporting solutions for offshore energy.
For Power BI enquiries, please contact: Ross Ord
at ross.ord@energymaritimeassociates.com or alternatively info@energymaritimeassociates.com
The offshore energy sector is undergoing a digital transformation. As projects grow in complexity and cost, the need for real-time, data-driven...
1 min read
In the offshore industry, timing isn’t just important. It is often the difference between winning work and arriving too late to matter. Among the...
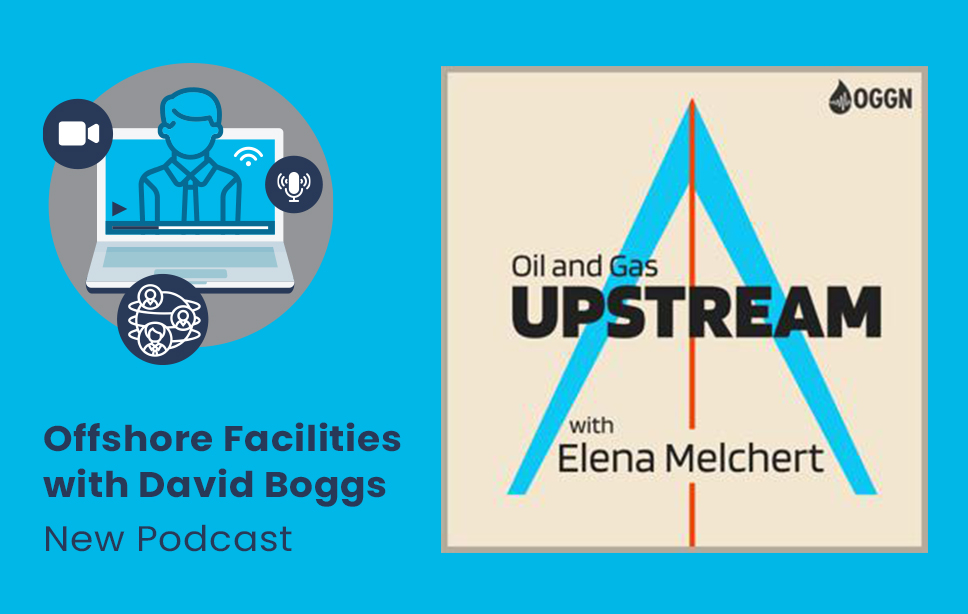
In this episode of Oil and Gas Upstream, host Elena Melchert speaks with David Boggs, Executive Director of Energy Maritime Associates. They discuss...